Kinematics
Introduction
Kinematics is concerned with the motion of objects in space. We can model motion by using some special equations and graphs.
The 'suvat' equations
In M1 there are several equations that you need to learn, which relate all of the physical vector quantities I've shown you so far in this topic.
I will provide proofs of these equations if you're curious about where they come from.
For all of these equations, $s$ is displacement, $v$ is final velocity, $u$ is initial velocity, $a$ is acceleration, and $t$ is time.
$$ s = \frac{u + v}{2}t $$
The average velocity is $$ \frac{u + v}{2} $$ So using the rearranged formula $s=vt$ gives $$ s = \frac{u + v}{2}t $$
$$ v = u + at $$
This is obvious from the definition of acceleration $$ \begin{align} a &= \frac{v-u}{t} \\ v &= u + at \end{align} $$
$$ s = ut+\frac{1}{2}at^{2} $$
Velocity is the first derivative of displacement with respect to time, so $$ s = \int v \mathop{dt} $$ So integrating $v = u + at$ with respect to time gives $$ \begin{align} s &= \int \left(u + at\right) \mathop{dt} \\ &= ut+\frac{1}{2}at^{2} \end{align} $$
$$ v^{2} = u^{2} + 2as $$
Rearrange the equation $v = u + at$ to make $t$ the subject $$ t=\frac{v - u}{a} $$ Sub this into the average velocity-displacement equation $s = \frac{u + v}{2}t$ $$ \begin{align} s &= \frac{1}{2}\left(u + v\right)\frac{v - u}{a} \\ &= \frac{\left(v + u\right)\left(v - u\right)}{2a} \\ 2as &= v^{2} - u^{2} \\ \therefore v^{2} &= u^{2} + 2as \end{align} $$
These are all valid for motion with constant acceleration.
Example
Q) A particle accelerates from $10 \textrm{ms}^{-1}$ to $20 \textrm{ms}^{-1}$ across a straight line of length 5m. Find the value of its acceleration during this motion, and the time it took.
A) We have $u = 10 \textrm{ms}^{-1}$, $v = 20 \textrm{ms}^{-1}$, $s=5\textrm{m}$, and $a$ is a required unknown, so we'll use $v^{2} = u^{2} + 2as$.
Rearrange this equation and sub in the values we know
$$ \begin{align} a &= \frac{v^{2} - u^{2}}{2s} \\ &= \frac{20^{2}-10^{2}}{\left(2\times 5\right)} \\ &= 30 \textrm{ms}^{-2} \end{align} $$
Now we know $a$, we can use $v = u + at$ to find $t$.
$$ \begin{align} t &=\frac{v - u}{a} \\ &= \frac{20-10}{30} \\ &= \frac{1}{3} \approx 0.33\textrm{s} \end{align} $$
Example
Q) A child drops a ball off a 10m high balcony. Neglecting air resistance, calculate the time taken for the ball to reach the ground, and the ball's velocity the instant before it hits the ground.
A) The ball is dropped from rest, so $u=0$, $s=10\textrm{m}$, and the only force acting on it is gravity, so $a=g$. The first required unknown is $t$, so we use $s = ut+\frac{1}{2}at^{2}$.
$$ \begin{align} 10 &= 0 + \frac{1}{2}gt^{2} \\ t &= \sqrt{\frac{20}{g}} \\ &= \frac{10}{7} \approx 1.43 \textrm{s} \end{align} $$
Now to find the velocity. We can use $v^{2}=u^{2}+2as$.
$$ \begin{align} v^{2} &= 0+\left(2\times g \times 10\right) \\ &= 196 \\ \therefore v &= 14 \textrm{ms}^{-1} \end{align} $$
Graphs
We can graph displacement, velocity, and acceleration against time to find out additional information about motion.
When drawing these graphs it's important to remember the calculus definitions of these three quantities. You don't strictly need to know this for M1, but it does make it easier to understand why the graphs make sense.
Since M1 only deals with simple motion with constant acceleration, it is a gentle introduction to the calculus relationships between the three quantities.
Displacement-time graphs
A displacement-time graph plots the displacement of an object relative to a point over time. Plot displacement on the $y$-axis in metres and time on the $x$-axis measured in seconds. Displacement can be negative since it's a vector.
Remember that $\frac{d\mathbf{s}}{dt} = \mathbf{v}$, where $\mathbf{s}$ is displacement and $\mathbf{v}$ is velocity. That means that the gradient of the displacement-time graph at any time is equal to the velocity at that time.
Example
Q) A particle moves with constant velocity to a point 100m away in seven seconds. It then immediately turns back and returns to its original position in three seconds at a higher constant velocity. Draw the displacement-time graph for this motion.
A) The particle has constant velocity, so the line will the straight, and moves to a point 100m away and then returns back. Using the time values given we can draw the displacement-time graph.
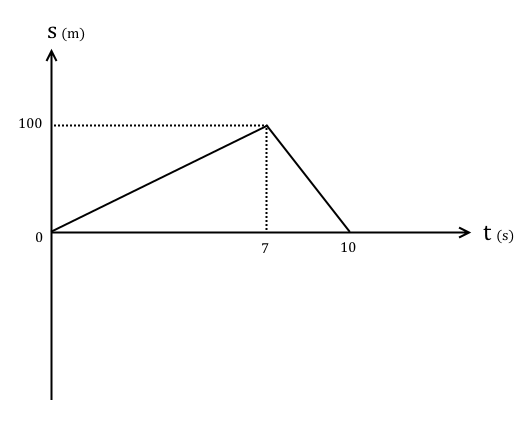
And from the graph we can see that the velocity in the first section is $\frac{100}{7} = 14.3 \textrm{ms}^{-1}$ (3.s.f.) and in the second section $\frac{-100}{3} = -33.3 \textrm{ms}^{-1}$ (3.s.f.).
Velocity-time graphs
A velocity-time graph plots the velocity of an object relative to a point over time. Plot velocity on the $y$-axis in $\textrm{ms}^{-1}$ and time on the $x$-axis measured in seconds. Velocity can be negative since it's a vector.
Also, since velocity is the first derivative of displacement with respect to time, the area between the velocity-time graph and the $x$-axis between any two points in time is equal to the total distance covered in that time period.
For our purposes in M1, all velocity-time graphs will either be straight horizontal lines (constant velocity) or straight diagonal lines (constant acceleration) so simple triangle area rules sometimes suffice to find the area underneath.
Additionally $\frac{d\mathbf{v}}{dt} = \mathbf{a}$, where $\mathbf{v}$ is velocity and $\mathbf{a}$ is acceleration. That means that the gradient of the velocity-time graph at any time is equal to the acceleration at that time.
Example
Q) A ball is dropped from rest at the top of a balcony and hits the ground five seconds later. Neglecting air resistance, draw the velocity-time graph, and use it to find the velocity of the ball the instant before it hits the ground, and the height it fell from.
A) The ball starts from rest and experiences constant acceleration due to gravity $9.8\textrm{ms}^{-2}$, hitting the ground (coming to rest again abruptly) five seconds later. That's enough information to draw the velocity-time graph.
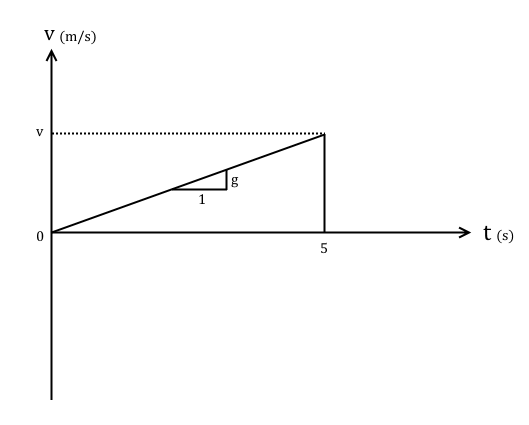
The gradient of the graph is $g$ because it falls under the influence of gravity only. Therefore
$$ g = \frac{v}{5} \Rightarrow v = 5g = 49 \textrm{ms}^{-1} $$
Now to find the height it fell from, using the formula for the area of a right angle triangle.
$$ \int_{0}^{5} \mathbf{v} \mathop{dt} = \frac{1}{2}\times 5 \times 49 = 122.5 \textrm{m} $$
Acceleration-time graphs
An acceleration-time graph plots the acceleration of an object relative to a point over time. Plot acceleration on the $y$-axis in $\textrm{ms}^{-2}$ and time on the $x$-axis measured in seconds. acceleration can be negative since it's a vector.
In M1 acceleration-time graphs rarely come up, but when they do they're always straight horizontal lines.
Example
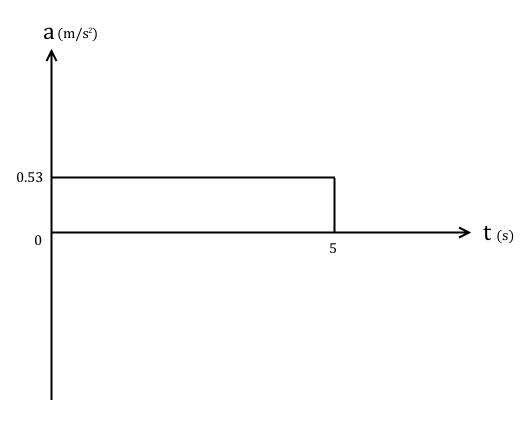
Q) A man applies a force of 200N for five seconds to push a 100kg sled forward across a rough surface with coefficient of friction 0.15. Plot the acceleration-time graph for this motion.
A) The surface is rough with $\mu = 0.15$. Resolving vertically we have $R = 100g$, so $F_f = 0.15\times 100g = 147 \textrm{N}$. Therefore resolving forces horizontally and using N2L
$$ 200 - 147 = 100 a $$
$$ \therefore a = 0.53 \textrm{ms}^{-2} $$
So the acceleration-time graph is a straight horizontal line with $a = 0.53 \textrm{ms}^{-2}$.